4.3. Managing processes
4.3.1. Work for the system admin
While managing system resources, including processes, is a task for the local system administrator, it doesn't hurt a common user to know something about it, especially where his or her own processes and their optimal execution are concerned.
We will explain a little bit on a theoretical level about system performance, though not as far as hardware optimization and such. Instead, we will study the daily problems a common user is confronted with, and actions such a user can take to optimally use the resources available. As we learn in the next section, this is mainly a matter of thinking before acting.

4.3.2. How long does it take?
Bash offers a built-in time command that displays how long a command takes to execute. The timing is highly accurate and can be used on any command. In the example below, it takes about a minute and a half to make this book:
billy:~/xml/src>time make Output written on abook.pdf (222 pages, 1619861 bytes). Transcript written on abook.log. real 1m41.056s user 1m31.190s sys 0m1.880s |
The GNU time command in /usr/bin (as opposed to the shell built-in version) displays more information that can be formatted in different ways. It also shows the exit status of the command, and the total elapsed time. The same command as the above using the independent time gives this output:
billy:~/xml/src>/usr/bin/time make Output written on abook.pdf (222 pages, 1595027 bytes). Transcript written on abook.log. Command exited with non-zero status 2 88.87user 1.74system 1:36.21elapsed 94%CPU (0avgtext+0avgdata 0maxresident)k 0inputs+0outputs (2192major+30002minor)pagefaults 0swaps |
Refer again to the Info pages for all the information.
4.3.3. Performance
To a user, performance means quick execution of commands. To a system manager, on the other hand, it means much more: the system admin has to optimize system performance for the whole system, including users, all programs and daemons. System performance can depend on a thousand tiny things which are not accounted for with the time command:
the program executing is badly written or doesn't use the computer appropriately
access to disks, controllers, display, all kinds of interfaces, etc.
reachability of remote systems (network performance)
amount of users on the system, amount of users actually working simultaneously
time of day
...
4.3.4. Load
In short: the load depends on what is normal for your system. My old P133 running a firewall, SSH server, file server, a route daemon, a sendmail server, a proxy server and some other services doesn't complain with 7 users connected; the load is still 0 on average. Some (multi-CPU) systems I've seen were quite happy with a load of 67. There is only one way to find out - check the load regularly if you want to know what's normal. If you don't, you will only be able to measure system load from the response time of the command line, which is a very rough measurement since this speed is influenced by a hundred other factors.
Keep in mind that different systems will behave different with the same load average. For example, a system with a graphics card supporting hardware acceleration will have no problem rendering 3D images, while the same system with a cheap VGA card will slow down tremendously while rendering. My old P133 will become quite uncomfortable when I start the X server, but on a modern system you hardly notice the difference in the system load.
4.3.5. Can I do anything as a user?
A big environment can slow you down. If you have lots of environment variables set (instead of shell variables), long search paths that are not optimized (errors in setting the path environment variable) and such, the system will need more time to search and read data.
In X, window managers and desktop environments can be real CPU-eaters. A really fancy desktop comes with a price, even when you can download it for free, since most desktops provide add-ons ad infinitum. Modesty is a virtue if you don't buy a new computer every year.
4.3.5.1. Priority
The priority or importance of a job is defined by it's nice number. A program with a high nice number is friendly to other programs, other users and the system; it is not an important job. The lower the nice number, the more important a job is and the more resources it will take without sharing them.
Making a job nicer by increasing its nice number is only useful for processes that use a lot of CPU time (compilers, math applications and such). Processes that always use a lot of I/O time are automatically rewarded by the system and given a higher priority (a lower nice number), for example keyboard input always gets highest priority on a system.
Defining the priority of a program is done with the nice command.
Most systems also provide the BSD renice command, which allows you to change the niceness of a running command. Again, read the man page for your system-specific information.
 | Interactive programs |
|---|---|
It is NOT a good idea to nice or renice an interactive program or a job running in the foreground. |
Use of these commands is usually a task for the system administrator.
4.3.5.2. CPU resources
On every Linux system, many programs want to use the CPU(s) at the same time, even if you are the only user on the system. Every program needs a certain amount of cycles on the CPU to run. There may be times when there are not enough cycles because the CPU is too busy. The uptime command is wildly inaccurate (it only displays averages, you have to know what is normal), but far from being useless. There are some actions you can undertake if you think your CPU is to blame for the unresponsiveness of your system:
Run heavy programs when the load is low. This may be the case on your system during the night. See next section for scheduling.
Prevent the system from doing unnecessary work: stop daemons and programs that you don't use, use locate instead of a heavy find, ...
Run big jobs with a low priority
If none of these solutions are an option in your particular situation, you may want to upgrade your CPU. On a UNIX machine this is a job for the system admin.
4.3.5.3. Memory resources
When the currently running processes expect more memory than the system has physically available, a Linux system will not crash; it will start paging, or swapping, meaning the process uses the memory on disk or in swap space, moving contents of the physical memory (pieces of running programs or entire programs in the case of swapping) to disk, thus reclaiming the physical memory to handle more processes. This slows the system down enormously since access to disk is much slower than access to memory. The top command can be used to display memory and swap use. Systems using glibc offer the memusage and memusagestat commands to visualize memory usage.
If you find that a lot of memory and swap space are being used, you can try:
Killing, stopping or renicing those programs that use a big chunk of memory
Adding more memory (and in some cases more swap space) to the system.
Tuning system performance, which is beyond the scope of this document. See the Appendix Areading list in Appendix 1 for more.
4.3.5.4. I/O resources
While I/O limitations are a major cause of stress for system admins, the Linux system offers rather poor utilities to measure I/O performance. The ps, vmstat and top tools give some indication about how many programs are waiting for I/O; netstat displays network interface statistics, but there are virtually no tools available to measure the I/O response to system load, and the iostat command gives a brief overview of general I/O usage. Various graphical front-ends exist to put the output of these commands in a humanly understandable form.
Each device has its own problems, but the bandwidth available to network interfaces and the bandwidth available to disks are the two primary causes of bottlenecks in I/O performance.
Network I/O problems:
Network overload:
The amount of data transported over the network is larger than the network's capacity, resulting in slow execution of every network related task for all users. They can be solved by cleaning up the network (which mainly involves disabling protocols and services that you don't need) or by reconfiguring the network (e.g. use of subnets, replacing hubs with switches, upgrading interfaces and equipment).
Network integrity problems:
Occurs when data is transferred incorrectly. Solving this kind of problem can only be done by isolating the faulty element and replacing it.
Disk I/O problems:
per-process transfer rate:
Read or write speed for a single process.
aggregate transfer rate:
Maximum total bandwidth that the system can provide to all programs that run.
This kind of problem is more difficult to detect, and usually takes extra hardware in order to re-divide data streams over buses, controlers and disks, if overloaded hardware is cause of the problem. One solution to solve this is a RAID array configuration optimized for input and output actions. This way, you get to keep the same hardware. An upgrade to faster buses, controlers and disks is usually the other option.
If overload is not the cause, maybe your hardware is gradually failing, or not well connected to the system. Check contacts, connectors and plugs to start with.
4.3.5.5. Users
Users can be divided in several classes, depending on their behavior with resource usage:
Users who run a (large) number of small jobs: you, the beginning Linux user, for instance.
Users who run relatively few but large jobs: users running simulations, calculations, emulators or other programs that eat a lot of memory, and usually these users have accompanying large data files.
Users who run few jobs but use a lot of CPU time (e.g. developers).
You can see that system requirements may vary for each class of users, and that it can be hard to satisfy everyone. If you are on a multi-user system, it is useful (and fun) to find out habits of other users and the system, in order to get the most out of it for your specific purposes.
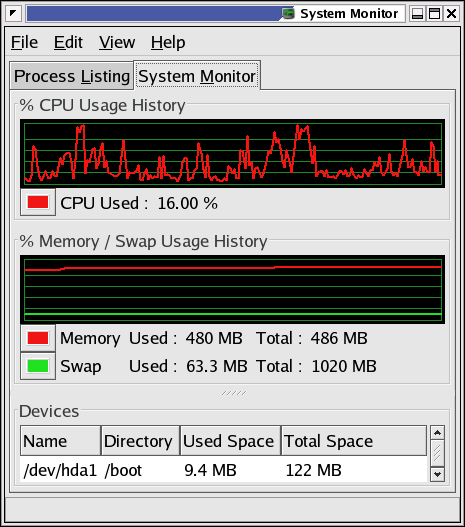
4.3.5.6. Graphical tools
For the graphical environment, there are a whole bunch of monitoring tools available. Below is a screen shot of the Gnome System Monitor, which has features for displaying and searching process information, and monitoring system resources:
There are also a couple of handy icons you can install in the task bar, such as a disk, memory and load monitor. xload is another small X application for monitoring system load. Find your favorite!